Project case study · Statistics · Psychology & Neuroscience · Research in progress
MindHealth Observatory: Depression screening, population inequality and survey-weighted inference
An open, statistics-first investigation of CDC NHANES 2017–2018. Explore the question, planned analysis, sample-design requirements and limitations, with explicitly preliminary real-data execution evidence.
5,068eligible respondents
8.53%PHQ-9 ≥10 weighted
ExploratoryR result status
01 · Context
Research question
How does the prevalence of elevated depressive symptoms differ across socioeconomic and demographic strata once the NHANES sample design is respected?
02 · Methods
Approach
- Validate all nine PHQ-9 symptoms and survey eligibility before scoring.
- Use 2-year MEC weights, masked strata and PSU identifiers for design-based estimates.
- Estimate weighted prevalence, survey-weighted GLMs, design-aware confidence intervals and nonlinear income sensitivity.
- Audit complete-case selection and report all weights, denominators and exclusion rules.
03 · Evaluation
Reported results
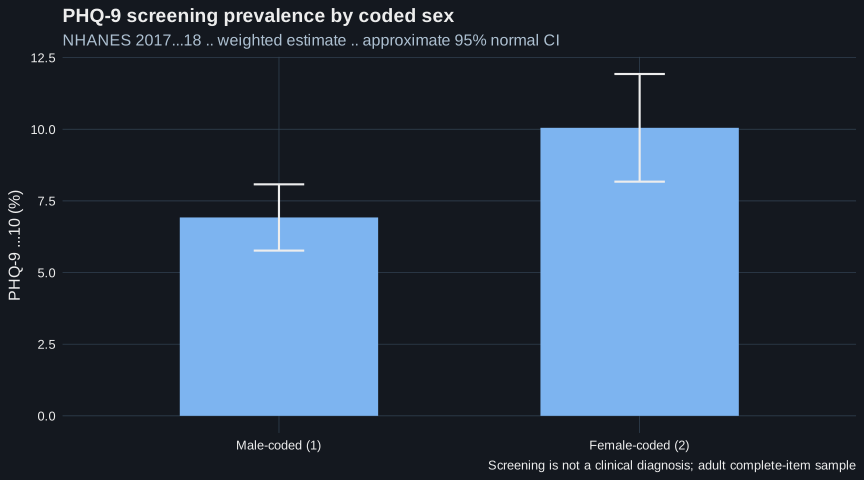
- An R 4.5.0 execution on CDC NHANES 2017–2018 analyzed 5,068 eligible complete PHQ-9 respondents. Design-weighted PHQ-9 ≥10 prevalence was 8.53% (95% CI 7.52%–9.55%; SE 0.52 percentage points). This is a screening threshold, not a clinical diagnosis.
- The observed execution artifacts, input hashes, package versions and restrictions are documented in the research evidence ledger. Full reproducibility and sensitivity gates are still outstanding.
- Interpretation remains exploratory and no causal, diagnostic or peer-reviewed conclusion is asserted.
- Fresh design-based sensitivity on the same 5,068 respondents found PHQ-9 screen-positive percentages of 24.72% (cutoff 5), 8.53% (cutoff 10), and 2.81% (cutoff 15). These are descriptive screening cutoffs, not diagnoses.
04 · Scope
Limitations
The reported estimate and SE were obtained from an observed R run, but have not been independently replicated; NHANES nonresponse, single-cycle design and complete-item exclusion constrain generalization.
05 · Observations
Exploratory figures