Project case study · Statistics · Psychology & Neuroscience · Research in progress
SchoolMind Global: School belonging, bullying and uncertainty in international comparisons
A statistical investigation of PISA 2022 school belonging. The actual 2.1 GB student file was processed in memory-bounded batches, and valid survey-weighted estimates and confidence intervals were obtained for 78 economies.
01 · Context
Research question
Do apparent national differences in school belonging survive measurement and complex-sampling uncertainty?
02 · Methods
Approach
- Validate the BELONG, bullying and ESCS indicators against the PISA codebook.
- Use the final student weight and 80 Fay-BRR replicates for uncertainty.
- Distinguish country-level descriptions from individual-level socioeconomic associations.
- Evaluate scaling comparability, response quality and exclusions before interpreting rankings.
03 · Evaluation
Reported results
- From 613,744 OECD PISA 2022 student rows in 80 economies, the current complete-case design-weight analysis retained 561,339 BELONG observations across 78 economies; ISR and KSV had too few complete observations for a published estimate.
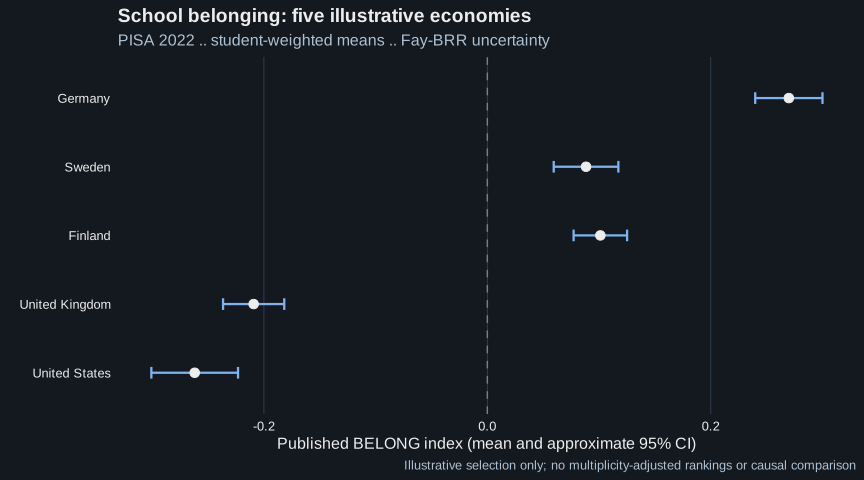
- Preliminary design-weighted BELONG means (95% Fay-BRR intervals): Germany 0.270 [0.240, 0.300], Finland 0.101 [0.077, 0.125], Sweden 0.088 [0.059, 0.117]. These five-country displays are illustrative, not multiplicity-adjusted rankings.
- All 78 country-level estimates, standard errors, exclusions, exact data SHA-256 and R scripts are documented in the research source directory. Interpretation remains exploratory pending measurement-equivalence and response-rate review.
- An independent Fay-BRR design calculation reproduced the archived PISA BELONG means and standard errors from 80 replicate-weight columns for Germany (n=5,278), Finland (n=9,736) and Sweden (n=5,820) to 1e-10 precision. Measurement equivalence remains untested.
04 · Scope
Limitations
OECD PISA 2022 observational student-level data. 78/80 economies were estimable under current complete-case rules; results are descriptive, not causal or measurement-invariance-validated. Low-response systems must be evaluated individually before ranking or generalization.
05 · Observations
Exploratory figures